Collect and store realtime data from the TP-LINK HS110
Just recently I’ve purchased a TP-LINK HS110 (the European/Dutch version) to get some more insight in how much power various devices in my household consume, especially in standby mode. To give a short description, the HS110 is a smart power plug which connects to your wifi network and can be controlled by a mobile app. Using the Kasa app you can control the smart plug i.e. turn it on or off, setup schedules and see realtime power consumption values.
Initial setup of the plug is easy, after plugging it in a power socket and connecting it to your wifi network using the Kasa app you get power readings right away. What the Kasa mobile app offers you is insight in the current power consumption and a total plus average for the last 7 days and the last 30 days. Next to that you can schedule when the HS110 should shut the power off or turn it on. And that’s basically it, which is good to some extent because that already helped me getting some insight on the power consumption for various devices in my household.
But, I wanted a bit more, I wanted to plot the power consumption data in a graph and see how the power consumption runs over a day for example. This way I can more precisely put together a schedule for when I should turn the power off for example. Unfortunately, I couldn’t find any existing tools or services (other than the Kasa app) which could communicate with the HS110 out of the box in some sort of way. So I decided to see if I could put some sort of simple script/tool together to retrieve the data I needed, my initial thought was to put together a simple Python script running on my Raspberry Pi2 (running Raspbian) which polls the smart plug. But before I could do that I needed to find out how the HS110 communicates over the network with the Kasa app. After some Googling I stumbled on an excellent article at https://www.softscheck.com/en/reverse-engineering-tp-link-hs110/ written by Lubomir Stroetmann and Tobias Esser, these guys have completely reversed engineered the HS110 and they saved me a massive amount of time figuring out how the HS110 works, so lot’s of kudos to those two guys. Even if you’re not interested in the HS110 it’s really interesting to read what steps they took and what techniques they used to reverse engineer the HS110.
But before I get to communicating with the HS110 I had to decide where I wanted to store the data I get from the HS110. A time-series metrics database should be perfect for this since it’s basically metric data I want to get by an interval. I don’t have any experience with a specific time-series database in particular but based on the ease of use described in their documentation I chose Graphite as the datastore for the power readings. To setup Graphite I followed the instructions in this fine article found here: https://www.digitalocean.com/community/tutorials/how-to-install-and-use-graphite-on-an-ubuntu-14-04-server, it is originally written for Ubuntu server but the instructions work fine for Raspbian as well.
So after having setup Graphite and making sure it properly works I used the information described in the article from Stroetmann and Esser to quickly put together a simple Python3 script. From their article I leardned that the HS110 is able to receive commands in (XOR encoded) JSON format (for a complete list of commands check out https://github.com/softScheck/tplink-smartplug/blob/master/tplink-smarthome-commands.txt). What I needed is the "get_realtime()" command from the "emeter" section, when send to the HS110 the device should respond with a message (in XOR encoded JSON format) containing three values: Current, Voltage and Power. The script I’ve put together gets the data from the HS110 (using the ‘{“emeter”:{“get_realtime”:{}}}’ command) and stores it in Graphite at an interval of 15 seconds. When the XOR encoded JSON response is received by the script it is decoded, parsed and directly send into Graphite using the hardcoded labels: hs110-tv.current, hs110-tv.voltage and hs110-tv.power. I’ve hardcoded the HS110 IPv4 network address and the ‘{“emeter”:{“get_realtime”:{}}}’ command as well, I might adjust it later so it’s able to receive those settings as command line arguments. As I’ve said, the script is put together rather quickly and I need to properly refine it but for now in this simple example it gets the job done. Check out the Gist below for the source code of the script I’ve put together and adjust the hardcoded values to your own needs if you like.
| import sys | |
| import time | |
| import socket | |
| import json | |
| import threading | |
| # https://stackoverflow.com/questions/21017698/converting-int-to-bytes-in-python-3 | |
| def int_to_bytes(x): | |
| return x.to_bytes((x.bit_length() + 7) // 8, 'big') | |
| def int_from_bytes(xbytes): | |
| return int.from_bytes(xbytes, 'big') | |
| # Based on: https://github.com/softScheck/tplink-smartplug/blob/master/tplink-smartplug.py | |
| def encrypt(string): | |
| key = 171 | |
| result = b"\0\0\0\0" | |
| for i in string: | |
| a = key ^ i | |
| key = a | |
| result += int_to_bytes(a) | |
| return result | |
| def decrypt(string): | |
| key = 171 | |
| result = b"" | |
| for i in string: | |
| a = key ^ i | |
| key = i | |
| result += int_to_bytes(a) | |
| return result | |
| def send_hs_command(address, port, cmd): | |
| data = b"" | |
| tcp_sock = socket.socket(socket.AF_INET, socket.SOCK_STREAM) | |
| try: | |
| tcp_sock.connect((address, port)) | |
| tcp_sock.send(encrypt(cmd)) | |
| data = tcp_sock.recv(2048) | |
| except socket.error: | |
| print("Socket closed.", file=sys.stderr) | |
| finally: | |
| tcp_sock.close() | |
| return data | |
| def store_metrics(current, voltage, power): | |
| current_time = time.time() | |
| tcp_sock = socket.socket(socket.AF_INET, socket.SOCK_STREAM) | |
| try: | |
| tcp_sock.connect(("localhost", 2003)) | |
| tcp_sock.send("hs110-tv.voltage {0} {1} \n".format(voltage, current_time).encode()) | |
| tcp_sock.send("hs110-tv.current {0} {1} \n".format(current, current_time).encode()) | |
| tcp_sock.send("hs110-tv.power {0} {1} \n".format(power, current_time).encode()) | |
| except socket.error: | |
| print("Unable to open socket on graphite-carbon.", file=sys.stderr) | |
| finally: | |
| tcp_sock.close() | |
| def run(): | |
| threading.Timer(15.0, run).start() | |
| data = send_hs_command("192.168.1.4", 9999, b'{"emeter":{"get_realtime":{}}}') | |
| if not data: | |
| print("No data returned on power request.", file=sys.stderr) | |
| store_metrics(0, 0, 0) | |
| return | |
| decrypted_data = decrypt(data[4:]).decode() | |
| json_data = json.loads(decrypted_data) | |
| emeter = json_data["emeter"]["get_realtime"] | |
| if not emeter: | |
| print("No emeter data returned on power request.", file=sys.stderr) | |
| store_metrics(0, 0, 0) | |
| return | |
| store_metrics(emeter["current"], emeter["voltage"], emeter["power"]) | |
| print("Stored values, current: {0}, voltage: {1}, power: {2}".format( | |
| emeter["current"], emeter["voltage"], emeter["power"])) | |
| run() |
I’m currently running this script as a service on my Raspberry Pi2 on Raspbian. I’ve put together the following unit file to load it up in systemd so it gets started in the background whenever the operating system starts.
[Unit]
Description=HS110-TV Service
After=syslog.target

[Service]
Type=simple
User=pi
WorkingDirectory=/home/pi/dev/hs110
ExecStart=/usr/bin/python3 /home/pi/dev/hs110/hs110-data-collect.py
StandardOutput=syslog
StandardError=syslog

[Install]
WantedBy=multi-user.target
If you want to use this unit file make sure you adjust the various paths so to match your setup. When you’ve done that just store the unit file in /lib/systemd/system/hs110.service and run the following command to let it start on boot:
sudo systemctl enable hs110.serviceYou can start the service right away by running:
sudo systemctl start hs110.serviceAnd check if it’s properly running by entering:
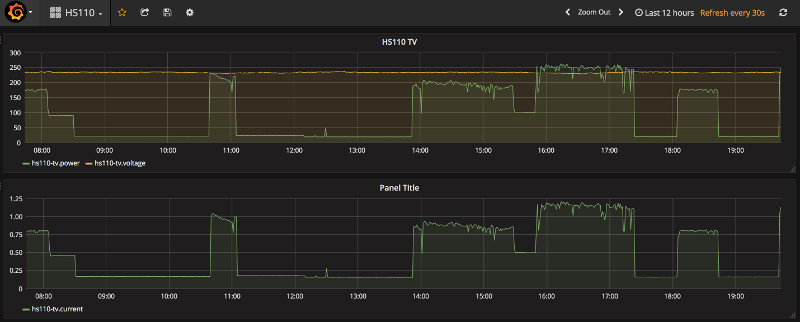
sudo systemctl status hs110.serviceI’m using Grafana to display and plot the collected data. Grafana allows me to easily connect to Graphite and configure various queries to plot out the data an easy way.
If you want to know how to setup Grafana on your Raspberry Pi in Raspbian then check out my post about Installing Grafana on the Raspberry Pi.
If you want an example on how this could look in Grafana, here are two graphs I was able to quickly conjure up in Grafana.